Tutorial 3: Model Gallery TUI Tutorial
This tutorial introduces the usage of the Model Gallery TUI. The Gallery runs a complete analysis pipeline for three model types (CANN1D / CANN2D / GridCell) in an interactive terminal interface, covering all subfigure visualizations corresponding to canns-experiments/figure2, and outputs results as PNG files.
Composite Full Result Figure
See Composite Full Result Figure. This will be replaced with actual output later.
Composite Full Result Figure
Tutorial Objectives
Select models and analysis modes in the TUI to generate image results
Understand the 5 standard visualizations for each model (aligned with subfigures in Composite Full Result Figure)
Master the result directory structure, file naming conventions, and log paths
Target Audience
Researchers who wish to quickly reproduce experimental script visualizations
Users who need to perform model analysis and result browsing within the terminal
Prerequisites
CANNs installed (recommended via
pip install -e .orpip install canns)Terminal width should be at least 120 columns, with a minimum of 100 columns
Launching the Model Gallery TUI
Recommended method: Use the unified entry point canns-tui, then select Model Gallery after startup.
canns-tui
# Select Model Gallery on the selection page after launch
You can also launch the Gallery directly:
python -m canns.pipeline.gallery
# or
canns-gallery
If a size warning appears after launch, please enlarge your terminal window or reduce the font size.
Interface Overview
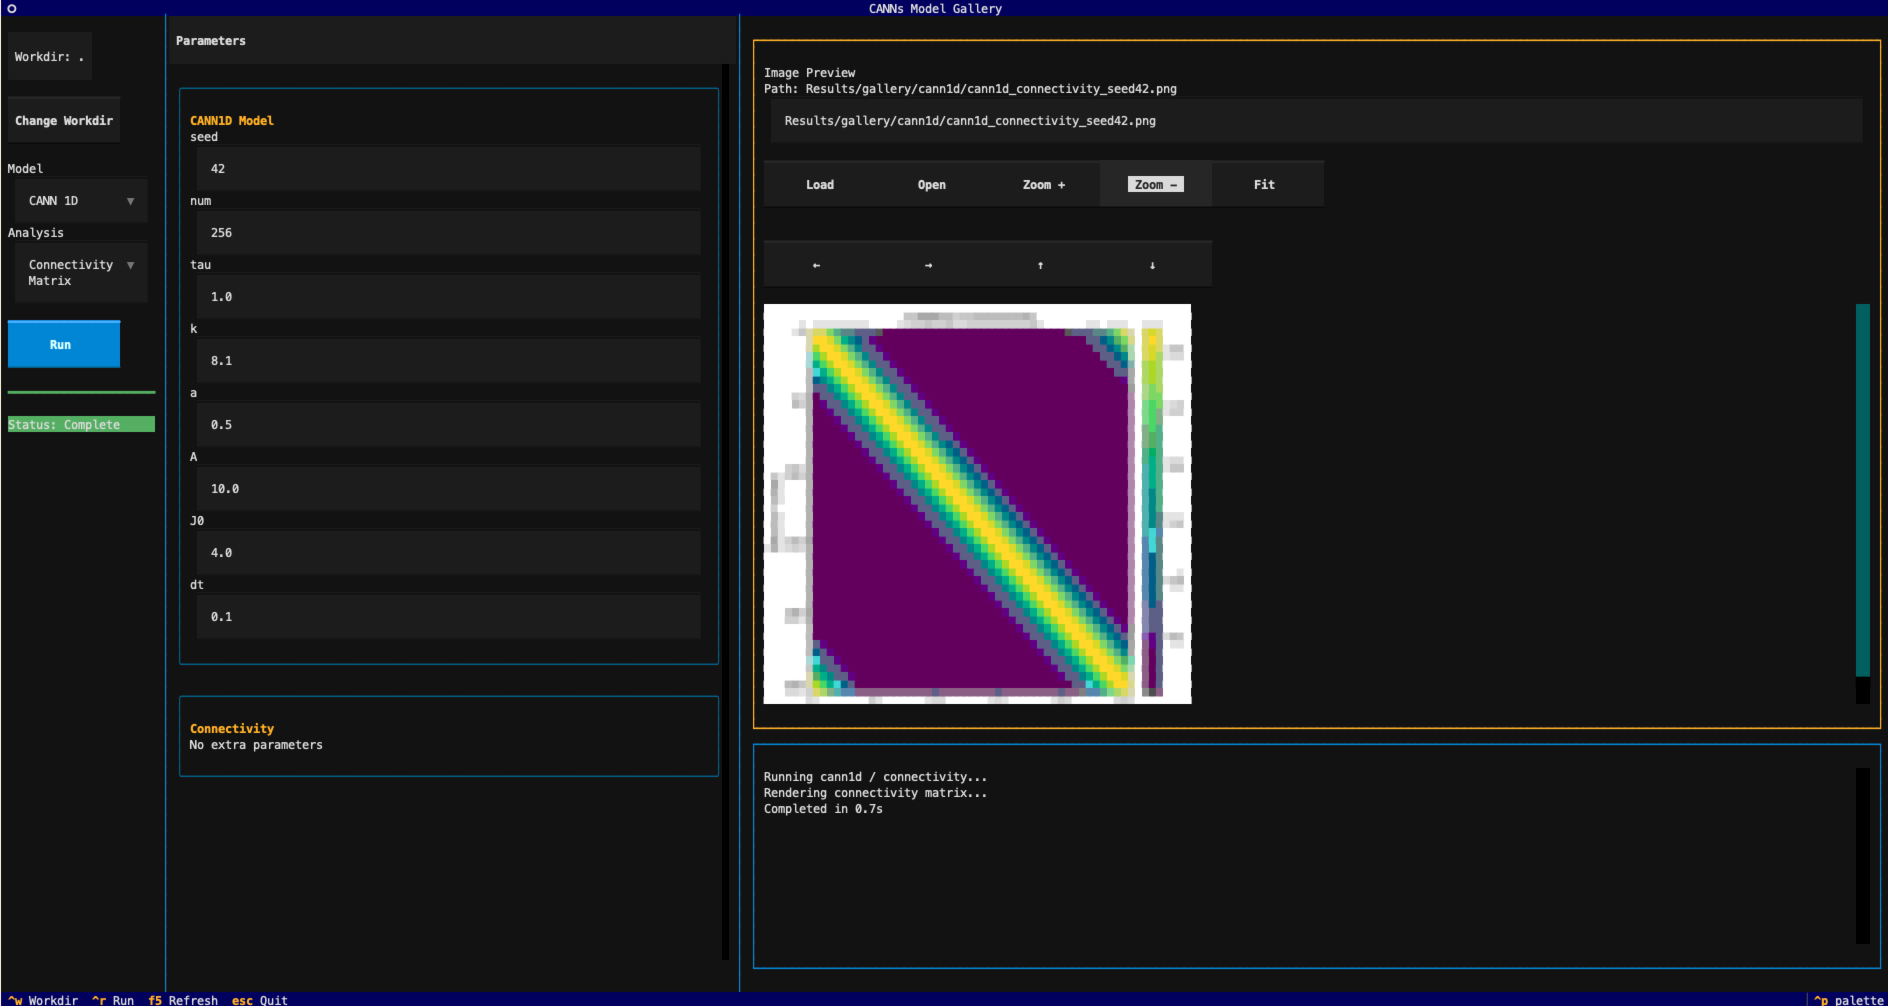
Model Gallery TUI Interface Overview
Interface Structure
Left: Model selection, analysis mode, run button, progress, and status
Center: Parameter panel (scrollable)
Right: Result preview and logs
Interface Element List
Left Operation Area
Model |
Select CANN1D / CANN2D / GridCell. |
Analysis |
Choose the analysis mode corresponding to the selected model (see “Model and Analysis Overview” below). |
Run |
Start the current analysis task. |
Progress Bar |
Displays task execution progress. |
Status |
Shows run status (Idle / Running / Success / Error). |
Center Parameter Area
Parameters |
Parameter panel for the current model; content is scrollable. |
Model Parameters |
Includes network size, time steps, connection parameters, etc. |
Analysis Parameters |
Different analysis modes have different parameters (e.g., duration / resolution / warmup). |
Right Result Area
Image Preview |
Terminal preview of result images (character-based). Use Open to view externally. |
Log Viewer |
Task runtime logs (including errors and path hints). |
Keyboard Shortcuts
Ctrl-W |
Switch working directory (Workdir). |
Ctrl-R |
Run the current analysis. |
F5 |
Refresh preview (reload result image). |
Esc |
Exit the application. |
Model and Analysis Overview
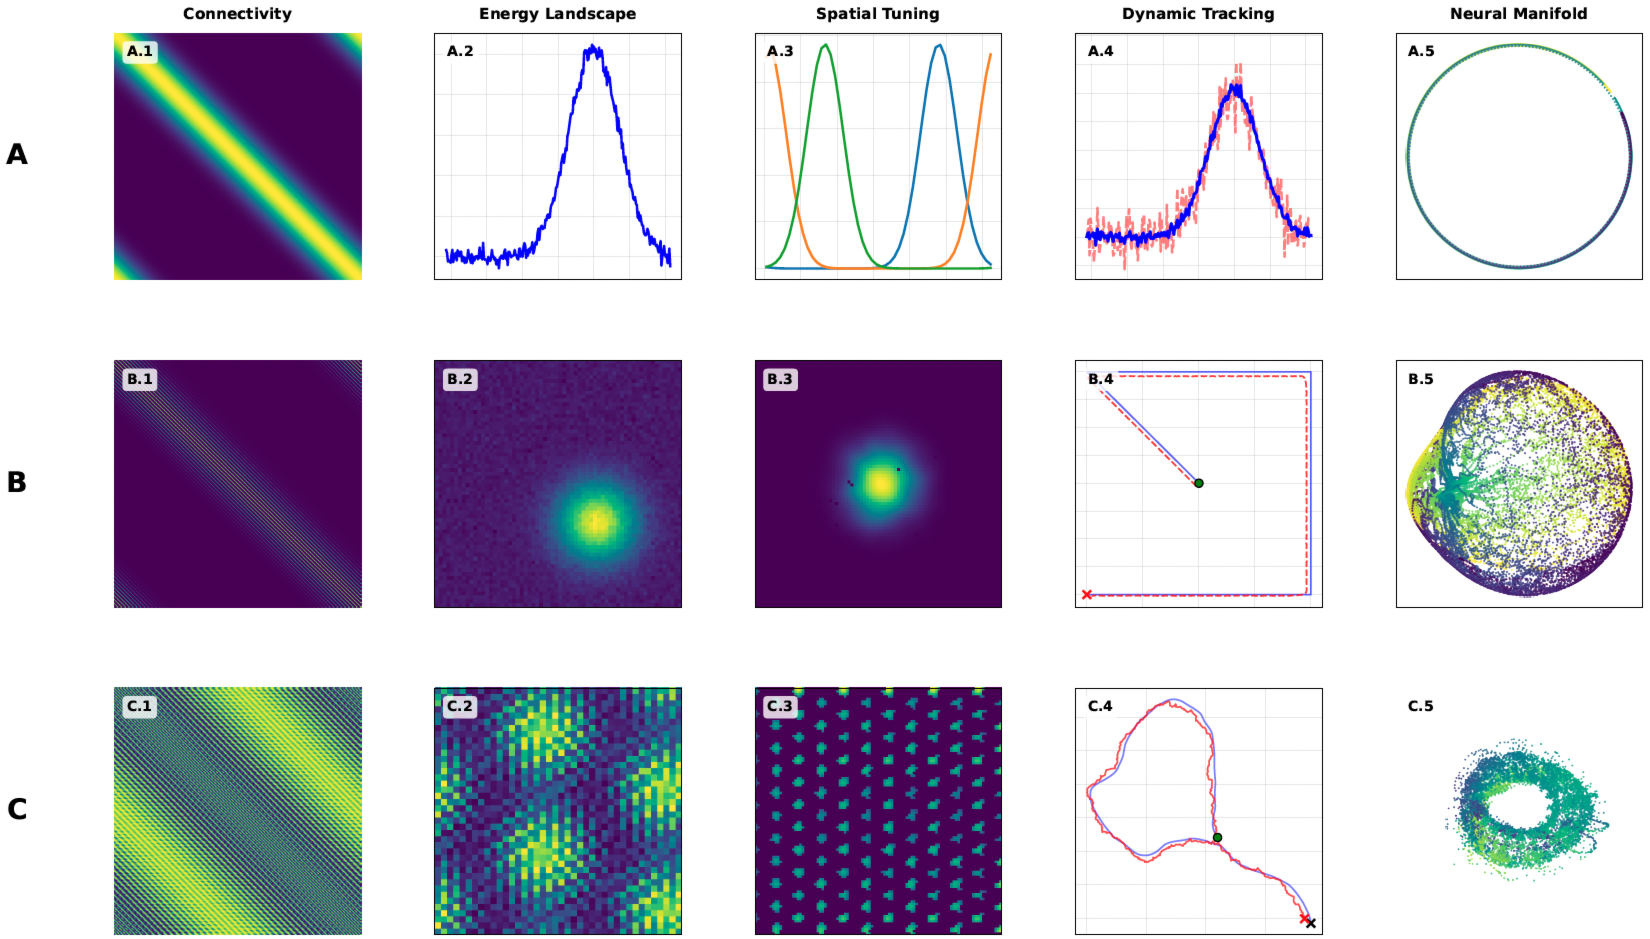
The Gallery’s analysis items are aligned with canns-experiments/figure2 (see Composite Full Result Figure):
CANN1D (A.1–A.5 / corresponding to the first row of Composite Full Result Figure):
Connectivity Matrix
Energy Landscape
Tuning Curves
Template Matching
Neural Manifold
CANN2D (B.1–B.5 / corresponding to the second row of Composite Full Result Figure):
Connectivity Matrix
Energy Landscape
Firing Field
Trajectory Comparison
Neural Manifold
GridCell (C.1–C.5 / corresponding to the third row of Composite Full Result Figure):
Connectivity Matrix
Energy Landscape
Firing Field (systematic rate map)
Path Integration
Neural Manifold
Parameter Description (Key Parameters)
CANN1D:
num: Number of neurons (default 256).dt: Time step (default 0.1).tuning_neurons: Comma-separated neuron indices (e.g.,64,128,192).manifold_warmup: Warmup duration to remove initial transient dynamics.
CANN2D:
length: Network side length (default 64).field_resolution: Firing field grid resolution (default 80).traj_warmup: Trajectory comparison warmup.manifold_downsample: Manifold sampling sparsification.
GridCell:
dt: Time step for the grid cell model (default5e-4).field_resolution: Systematic rate map resolution (default 100).energy_heal_steps/path_heal_steps: Initialization stabilization steps.
Workflow
Launch
canns-tuiand enter Model Gallery from the selection page.nSelect Model and Analysis on the left.n
Adjust model and analysis parameters in the center parameter area (scrollable).n
Click Run and wait for execution to complete.n
Preview result images on the right or click Open to use an external viewer.n
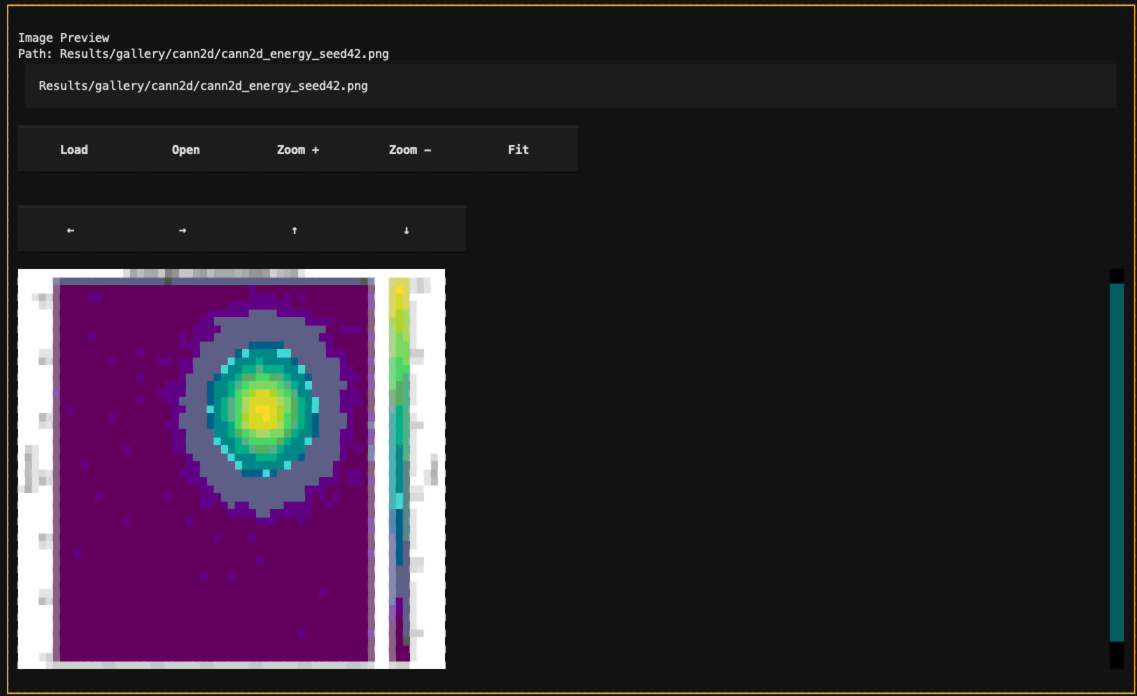
Result Output
All results are saved as PNG files under the working directory:
<workdir>/Results/gallery/<model>/
Filename example:
cann1d_energy_seed42.png
Logs and Preview
Runtime logs are displayed in real-time in the right-side Log Viewer. To save or copy logs, you can directly select and copy them in the terminal, or add a log file output feature when needed.
Placeholder for Interface Screenshots
Result Interface Screenshot
Common Issues
Scrollbar not visible: Please increase terminal height or use the mouse wheel to scroll the parameter area.
Long runtime: Some analyses (e.g., CANN2D / GridCell) use heavy default parameters; consider reducing
duration/resolution/num_batches.
Next Steps
Wait for replacement of placeholder screenshots and composite figures with real ones
Extend Gallery analysis items based on your actual parameter requirements