Tutorial 2: End-to-End ASA TUI Analysis Tutorial (Legacy)
This tutorial introduces how the ASA TUI (Attractor Structure Analyzer) integrates data preprocessing, TDA, decoding, and visualization from the ASA pipeline into an interactive terminal workflow. You will learn to complete analyses through the interface and manage results in your working directory.
Note
The ASA TUI is a legacy interface provided for transitional use. It is recommended to prioritize the ASA GUI Tutorial.
Tutorial Objectives
Complete an end-to-end analysis using ASA TUI
Understand input data structure, parameter meanings, and output directories
Master common analysis modes and their dependencies
Target Audience
Researchers needing rapid analysis of experimental neural recordings
Users who wish to execute the ASA pipeline through a visual interface
Experimental groups requiring reusable TDA/decoding/visualization workflows
Prerequisites
CANNs installed (recommended via
pip install -e .orpip install canns)Terminal width of at least 120 columns (minimum 100 columns)
Prepared ASA or Neuron + Trajectory data
Launching ASA TUI
Execute in your project environment:
python -m canns.pipeline.asa
# or
canns-tui
Note
canns-tui is now the unified entry point. Upon launch, you first select ASA or Model Gallery.
To enter ASA directly, use python -m canns.pipeline.asa.
If a size warning appears after launch, enlarge your terminal window or reduce the font size.
Interface Overview
The interface is divided into three columns:
Left: Working directory, run buttons, progress bar, and status information
Center: Parameter panel + file tree of the working directory
Right: Result preview and log output
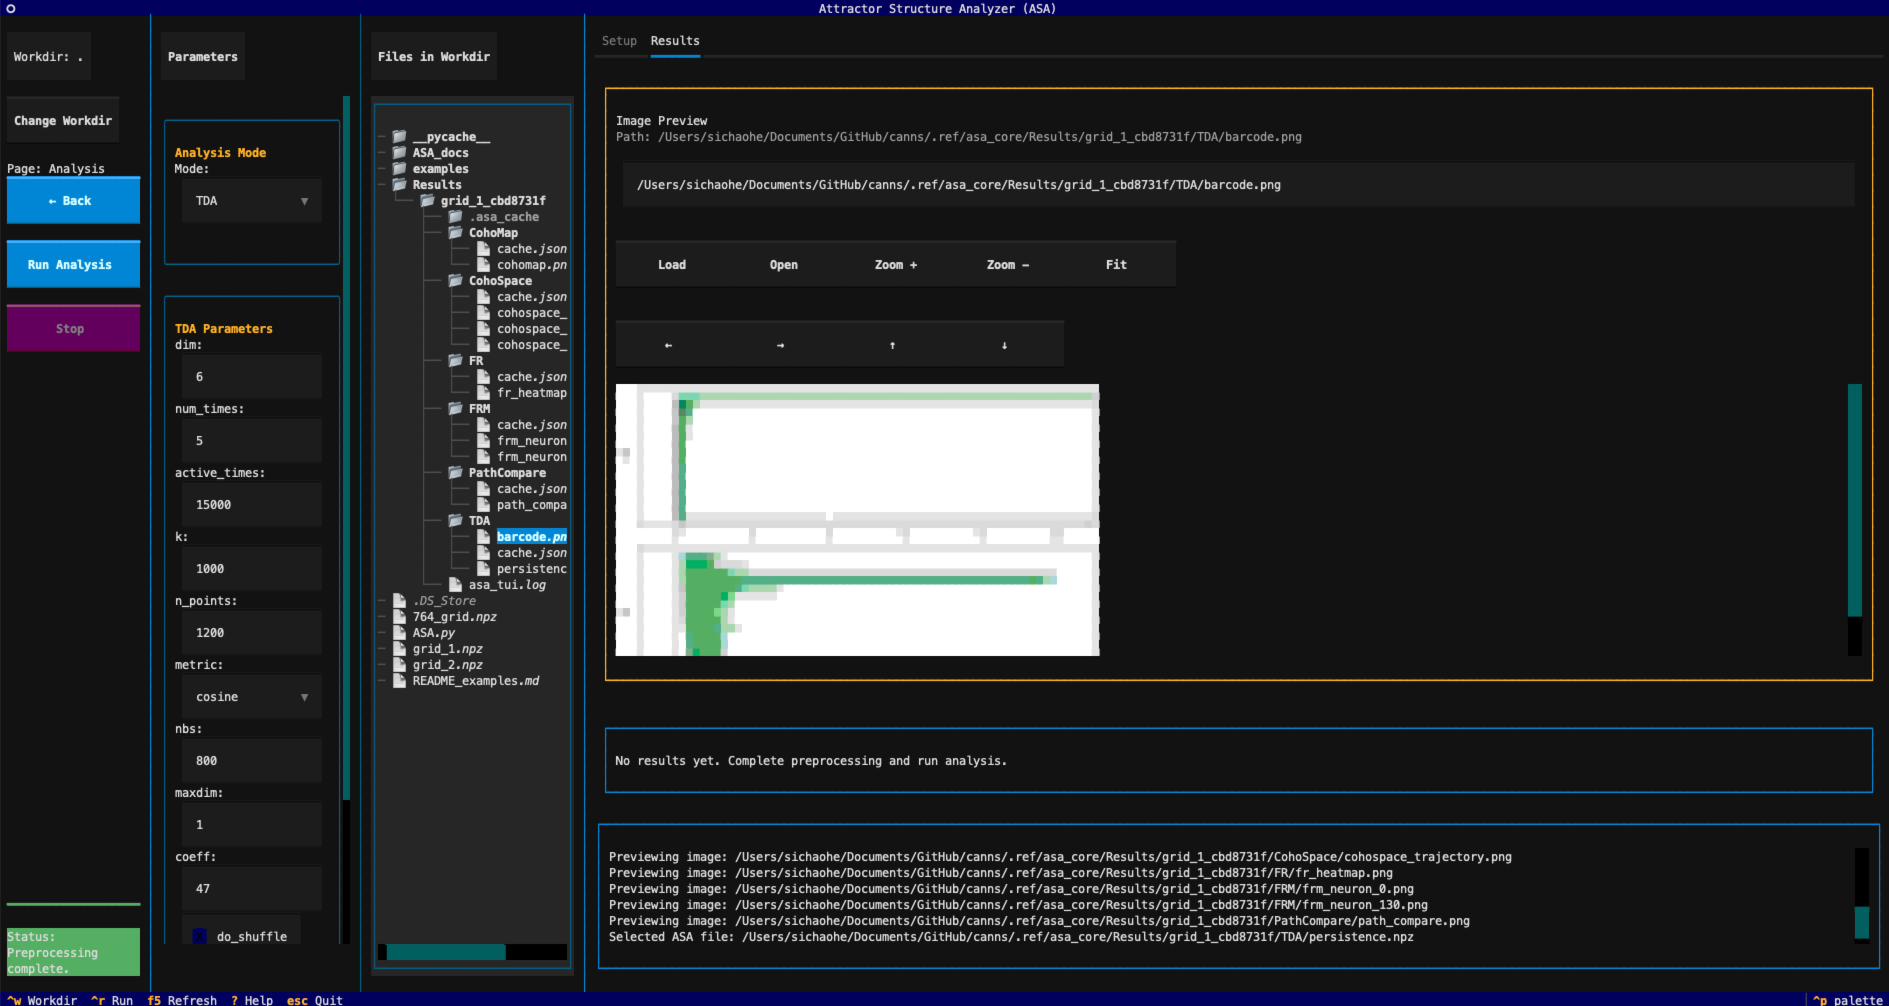
Main interface overview of ASA TUI
Interface Element Inventory
Left Action Panel
Workdir Tab |
Displays the current working directory path. |
Change Workdir |
Opens the working directory selection dialog (equivalent to |
Page Indicator |
Shows the current page: |
Continue → |
Triggers preprocessing and switches to the analysis page (visible only on the preprocessing page). |
← Back |
Returns to the preprocessing page (visible only on the analysis page). |
Run Analysis |
Runs the current analysis mode (visible only on the analysis page). |
Stop |
Requests termination of the current running task (available on the analysis page). |
Progress Bar |
Displays preprocessing/analysis progress. |
Status |
Shows run status (Idle / Running / Success / Error). |
Center Parameter Panel
Parameters |
Parameter control area, switching between preprocessing and analysis pages. |
Input Mode |
Select |
Preset |
Preset templates: |
Method |
Preprocessing method: |
Files in Workdir |
File tree of the working directory; selecting an image enables preview, and selecting a |
Right Result Panel
Setup Tab |
Displays quick operation hints. |
Results Tab |
Result preview and hint messages; automatically switches after analysis completion. |
Log Viewer |
Displays real-time logs; also writes to a log file. |
Note
Image previews in ASA TUI are rendered as terminal character graphics (based on climage).
If your system has a graphical interface and an image viewer, you can click Open to view the actual image externally.
Keyboard Shortcuts
Shortcut |
Function |
|
Select working directory |
|
Run current page action (Preprocess page = Continue, Analysis page = Run Analysis) |
|
Refresh preview |
|
Open help |
|
Exit application |
|
Switch focus between panels |
Workflow Overview
Select a working directory (containing data files)
Choose input mode and data files
Configure preprocessing parameters
Navigate to the analysis page and select an analysis mode
Run the analysis and view Results output
Step 1: Select Working Directory
Click the Change Workdir button on the left or press Ctrl-W to select a directory containing your data.
The file tree will refresh synchronously, facilitating input data selection and result inspection.
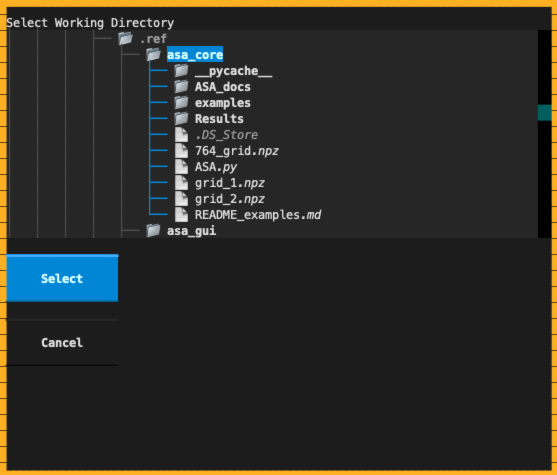
Working directory selection dialog
Working Directory Notes
The working directory determines the root location for the file tree and result output directory.
Switching the working directory resets the current input state; you must reselect data files.
Press
F5to refresh the file tree and current path display.
Step 2: Select Input Mode and Files
Input mode is located in the Input Mode dropdown:
ASA File: A single
.npzfile containingspikeandt(recommended to includex/y).Neuron + Traj: Separate neuron and trajectory files.
ASA File Format
Must contain at least spike and t:
spike: A denseT x Nmatrix, or a spike data structure that can be embeddedt: Time series (synchronized withspike)Optional:
x/yfor trajectory-related analyses
import numpy as np
np.savez(
    "session_asa.npz",
    spike=spike,
    t=t,
    x=x,
    y=y,
)
After selecting a .npz file in the file tree, the log area will indicate that an ASA file has been chosen.
Neuron + Traj Mode
Requires two types of .npz files:
Neuron: Contains
spike(or the entire file is a spike array)Traj: Contains
x/y/t
np.savez("neuron.npz", spike=spike)
np.savez("traj.npz", x=x, y=y, t=t)
Note
The current TUI version’s file tree only supports direct selection of ASA files. For Neuron + Traj mode,
it is recommended to first merge them into an ASA .npz file via script, or extend the selection logic as needed.
File Tree and Preview
When ASA File mode is selected and a
.npzfile is chosen, it sets the ASA input file.Selecting
.png/.jpg/.jpeg/.gif/.bmpfiles enables image preview on the right.After results are generated, the file tree automatically refreshes for easy browsing of the output directory.
Step 3: Preprocessing Configuration
Method offers two options:
None: Assumes input is already a denseT x NmatrixEmbed Spike Trains: Embeds spike times into a dense matrix (recommended)
Preset Explanation
Grid/HDrestores TDA and GridScore parameters to their respective defaults.Nonemakes no changes, preserving current parameter inputs.Manually adjusted parameters may be overwritten when switching presets.
Key Parameter Descriptions:
Parameter |
Description |
|
Embedding resolution / sampling length |
|
Sampling time step |
|
Smoothing kernel scale |
|
Whether to apply smoothing |
|
Whether to filter by speed |
|
Minimum speed threshold |
Note
The above parameters are editable only when Embed Spike Trains is selected; they are disabled when None is chosen.
After configuration, click Continue → to proceed to the analysis page.
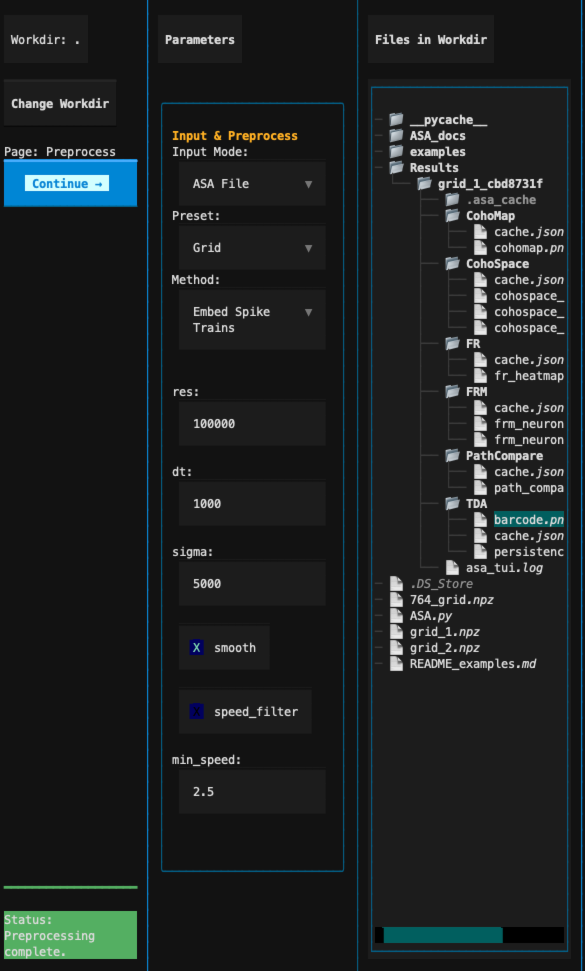
Preprocessing parameter section
Step 4: Select Analysis Mode
The analysis page supports the following modes:
TDA: Persistent homology analysis, generating barcodes
CohoMap: Phase decoding and cohomap based on TDA
PathCompare: Comparison of real vs. decoded trajectories
CohoSpace: Phase manifold projection and trajectory visualization
FR: Population firing rate heatmap
FRM: Single-neuron firing rate map
GridScore: Grid cell metric analysis
After selecting an analysis mode, the parameter panel automatically switches to the corresponding parameter group; Decode / CohoMap parameters are shared among CohoMap, PathCompare, and CohoSpace modes.
Dependencies:
CohoMap requires prior completion of TDA
PathCompare / CohoSpace depend on CohoMap
Analysis Parameter Details
TDA Parameters
|
Embedding dimension |
|
Number of samples |
|
Active time duration |
|
Number of neighbors |
|
Number of sample points |
|
Distance metric (cosine / euclidean / correlation) |
|
Neighborhood sampling count |
|
Maximum homology dimension |
|
Homology coefficient |
|
Whether to shuffle randomly |
|
Number of shuffles (editable only when |
|
Whether to use StandardScaler for normalization |
Decode / CohoMap Parameters
|
Decoding version: |
|
Expected number of circles |
|
Cohomap trajectory subsampling |
|
Enabled only in |
Note
When decode_version is v2, real_ground and real_of are disabled.
PathCompare Parameters
|
Use |
|
Available only when |
|
|
|
Dimension selection (enabled based on |
|
Optional field name override |
|
|
|
Time slicing ( |
|
Index slicing ( |
|
Sampling stride |
|
Angle unit (rad / deg / unit / auto) |
Note
When dim_mode is 1d, only dim is enabled; when 2d, dim1/dim2 are enabled.
When slice_mode is time, tmin/tmax are enabled; when index, imin/imax are enabled.
When use_box is disabled, interp_to_full is disabled.
CohoSpace Parameters
|
|
|
Dimension selection (enabled based on |
|
Use |
|
Percentage for selecting highly active neurons |
|
|
|
Specifiable in single-neuron view |
|
Trajectory subsampling ratio |
|
|
|
Enabled only when |
Note
When dim_mode is 1d, only dim is enabled; when 2d, dim1/dim2 are enabled.
When unfold is skew, skew_show_grid and skew_tiles are enabled.
FR Parameters
|
Neuron range (blank for all) |
|
Time range (blank for all) |
|
|
|
|
Note
Leaving neuron_start / neuron_end and time_start / time_end blank implies full range.
FRM Parameters
|
Neuron ID to plot |
|
Number of spatial bins |
|
Minimum occupancy threshold |
|
Whether to smooth |
|
Smoothing scale |
|
|
GridScore Parameters
|
Inner and outer radii of annular region |
|
Spatial bin size |
|
Smoothing scale |
Step 5: Run and View Results
Click Run Analysis or press Ctrl-R to start the analysis. Progress and logs are displayed in real time.
Final visualization results are previewed in the image preview widget.
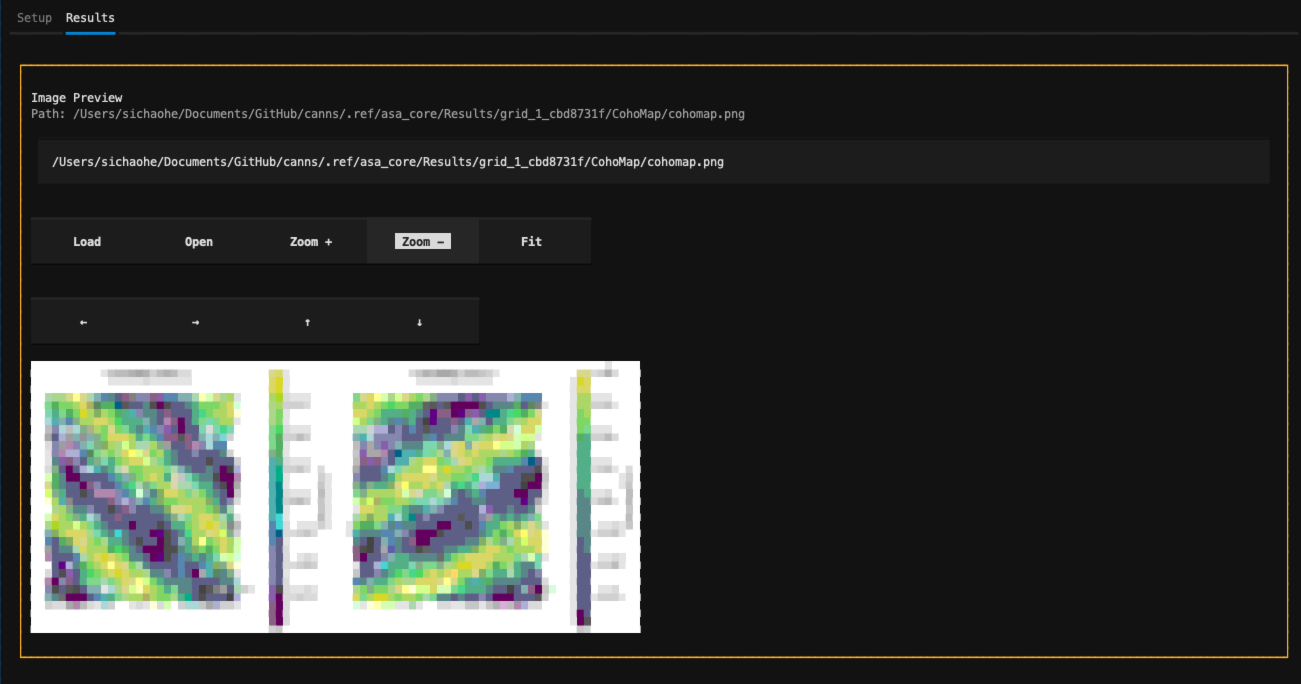
Analysis results and log area
Image Preview Widget
In the Image Preview area of the Results tab, you can directly operate:
Load: Reads the path from the input box and previews it within TUI; supports paths relative to the workdir.
Open: Invokes the system image viewer to open the original image (requires a graphical OS interface).
Zoom + / Zoom -: Zooms in or out of the terminal character graphic preview.
Fit: Resets zoom level and fits the current preview area.
↑/↓/←/→: Pans within the preview area (affects view only, not the image file).
Note
If climage is not installed, the preview area displays a filename hint; installation is recommended for character graphic previews.
Final results are saved by default in:
<workdir>/Results/<dataset_id>/
where dataset_id is composed of the input filename and a hash prefix.
Common output examples:
TDA/:barcode.png,persistence.npzCohoMap/:cohomap.png,decoding.npzPathCompare/:path_compare.pngCohoSpace/:cohospace_trajectory.png, (optional)cohospace_neuron_*.pngFR/:fr_heatmap.pngFRM/:frm_neuron_<id>.pngGridScore/:gridscore_distribution.png,gridscore.npz
Log files are written by default to:
<workdir>/Results/<dataset_id>/asa_tui.log
You can also preview image files by selecting them in the file tree.
Dialogs and Help
A warning dialog appears if the terminal size is insufficient, recommending a larger size.
An error dialog appears for parameter or input errors, showing the cause.
Press
?to open the help screen, listing shortcuts and workflow instructions.